
by Andrew Tredennick
Recently I moved from ArcMap to R do a lot of my spatial analysis and map making. In particular, I've started to use the 'ggplot2' to create what I think are exceptionally good-looking maps (no offense to ArcMap, but something about 'ggplot2' maps are just so crisp). A couple of people have asked for some code to help them on their way with map making in R, so here is a simple snippet of code I used to make a rainfall map of sub-Saharan Africa with a fake transect.
A couple notes.
 If you have any questions (e.g., about the specific commands within the ggplot call), post them in the comments and I'll address them.
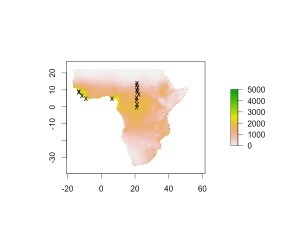
From the comments: here's a comparison using the base R plotting commands. I didn't work to match the colors because I was using default ggplot2 colors and wanted to compare with default base colors (one of the many great things about ggplot2 is pleasing default color options). Also notice the difference in tick positions and spacing. Of course, I could make this look a lot better, but that would take more work than it takes using ggplot2. Just my opinion though!
 Do you have any great science tricks you want to share? Email us at nrel.ecopress@gmail.com or tell us on Facebook, http://www.facebook.com/nrelscience.
- You will need the 'raster' and 'ggplot2' packages installed. In R this is easily achieved from command line via, install.packages("ggplot2") and install.packages("raster"). Some R interfaces (like RStudio) also have easy-to-use GUIs to help install new packages
- In this code I am creating the map from an ASCII file as exported from ArcMap (it was a raster I exported as ASCII).
If you have any questions (e.g., about the specific commands within the ggplot call), post them in the comments and I'll address them.
From the comments: here's a comparison using the base R plotting commands. I didn't work to match the colors because I was using default ggplot2 colors and wanted to compare with default base colors (one of the many great things about ggplot2 is pleasing default color options). Also notice the difference in tick positions and spacing. Of course, I could make this look a lot better, but that would take more work than it takes using ggplot2. Just my opinion though!
 Do you have any great science tricks you want to share? Email us at nrel.ecopress@gmail.com or tell us on Facebook, http://www.facebook.com/nrelscience.