
This article is co-written by Lindsey Middleton and Dr. Imtiaz Rangwala and edited by Isabella Oleksy

A team of climate scientists working in collaboration with the North Central Climate Science Center (NC CSC, hosted by NREL) and NOAA’s Physical Sciences Division has taken part in building a new tool that would improve our understanding of both flash droughts and longer-term drought.
Drought can be measured using a number of different models. The Palmer Drought Severity Index (PDSI), for example, is one of the longest-used drought indices. The PDSI has traditionally used observed precipitation and temperature data to model soil water content in order to determine drought severity. Tools like the PDSI accurately represent long-term drought patterns but can significantly lag in their response, meaning that rapid-onset drought (“flash” drought) might have already been occurring in a region for up to several months without a reliable indication from the model.
A newly-developed NOAA tool – EDDI, or the Evaporative Demand Drought Index – works a little differently from PDSI and other drought indices (such as SPI, PDSI, NLDAS, and the Climate Prediction Center’s modeled soil moisture products & remotely sensed actual evapotranspiration), and may be used in conjunction with these indices to provide a more well-rounded understanding of drought as it occurs.
EDDI was developed exclusively to monitor atmospheric evaporative demand (E0), also described as atmospheric “thirst.” Over shorter time frames of weeks and months, EDDI provides early warning for rapidly-evolving flash droughts and indicate the persistence of ongoing drought.
Climate change is expected to increase the occurrence of flash droughts in particular, primarily because a warmer atmosphere is also a thirstier atmosphere. Montana and the Dakotas, for example, experienced flash droughts this past growing season, and the Wind River Indian Reservation (WRIR) in Wyoming experienced a rapid-onset drought in 2015 that played a hand in water shortages.
EDDI in the Field #1:
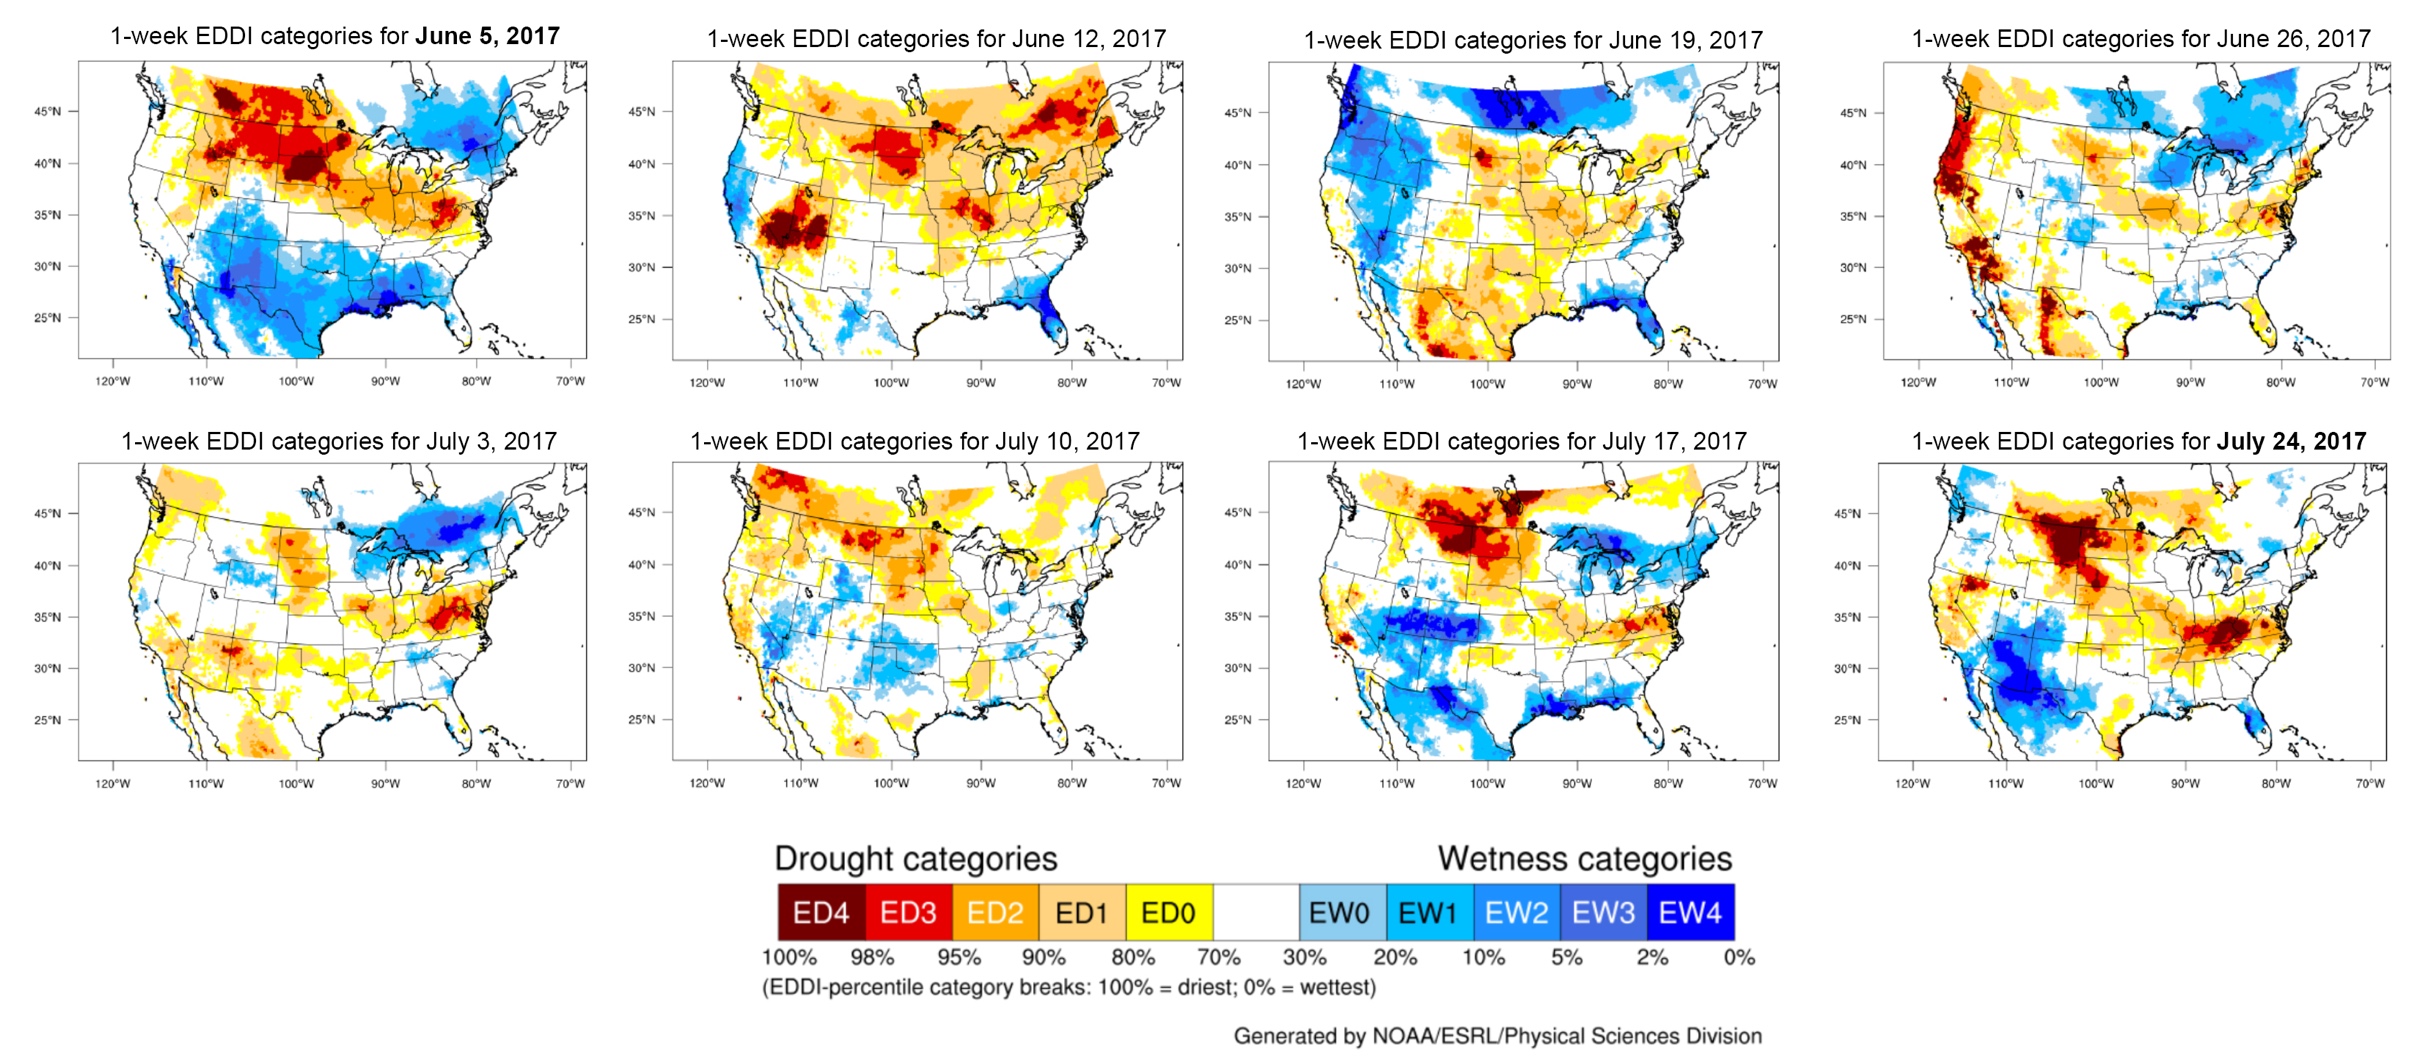
2017 Flash Drought in the Northern Great Plains
During the summer of 2017, the Dakotas and eastern Montana experienced severe to exceptional drought conditions, much of which continued into the Fall of 2017. In early May, when soil moisture conditions were near normal, weekly EDDI maps (one-week and two-week maps) started to show above-average evaporative demand. This was further exacerbated by early June when much of the region had E0 values above the 90th percentile. This high evaporative stress was sustained until the end of July (see figure). The U.S. Drought Monitor (USDM) started to show significant drought conditions by early- to mid-June, over a month after early EDDI indications of high E0. Based on a combination of monitoring tools, the Northern Great Plains were showing high EDDI values and USDM drought conditions in early June, depleted soil moisture, and an unfavorable weekly precipitation outlook, indicating that drought would continue to grow and become more severe over the following weeks, which it did. Drought in the Great Plains had significant impacts on the 2017 growing season.
EDDI in the Field #2:
Diagnosing Water Stress at the Wind River Indian Reservation During the 2015 Irrigation Season
The EDDI climate team has been involved in a multi-institutional drought preparedness project for the Wind River Indian Reservation (WRIR), a project co-led by Shannon McNeeley of the NC CSC. The climate team’s contributions included climate outreach and analyses of the region’s hydro-climate, based on satellite data and snow modeling. Results published recently (McNeeley et al., 2017) included an analysis of the 2015 WRIR irrigation season and implications for the use of EDDI to diagnose water shortages.
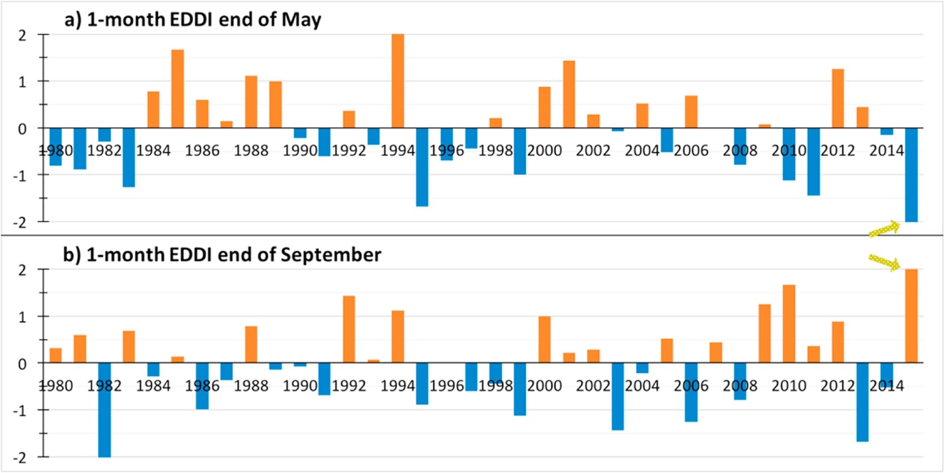
As part of their analyses, the NC CSC climate team found that there was a rapid shift from extremely wet to extremely dry conditions within the 2015 irrigation season at the WRIR. Surplus precipitation and cooler temperatures in May drove the one-month EDDI at the end of May to a record low. EDDI then increased substantially, driven primarily by high winds, warmer temperatures, and lower humidity, setting a record high value for September (see EDDI time-series figure).
Despite U.S. Drought Monitor indications of a low-drought season and wetter-than-normal conditions reported by the High Plains Regional Climate Center (HPRCC), the reservation experienced water shortages in 2015 in the Little Wind Basin, which supplies water to 30,000 acres of land. Highly-localized, short-term droughts impacted this basin more heavily than nearby water basins due to unique social and environmental characteristics of this water system. Heavy precipitation and early snowmelt meant that the Washakie Reservoir, one of the Little Wind Basin’s primary water storage areas, filled to capacity early, and extra water had to be released downstream. Drought then intensified later in the season. This, coupled with early snowmelt, meant that the reservoir had to close about a month ahead of its typical schedule, which significantly impacted local producers.
Given climate projections and their potential impacts for socially and environmentally unique landscapes like the Little Wind Basin, it becomes important to understand how rapid-onset droughts might increasingly impact vital water resources. Adding EDDI to the repertoire can provide a more well-rounded picture to assist the management of water and other natural resources.
Learn More
A newly-developed EDDI website offers:
- Maps of current conditions for the continental U.S.
- Historical EDDI maps going back to 1980
- A time-series tool
- This EDDI time series generation tool was developed by NC CSC scientists and allows users to generate monthly or seasonal EDDI time series for a region of interest, which could then be compared with long-term impacts data
- A comprehensive but hands-on EDDI User Guide
The website provides an introduction and access to EDDI data and interpretation, with the hope that users integrating EDDI into their toolbox to improve the monitoring and anticipation of drought and its various impacts.
More information on Wind River Indian Reservation drought analyses:
McNeeley S.M., C. Dewes, C. J. Stiles, T. Beeton, I. Rangwala, M. Hobbins, C. Knutson (2017). Anatomy of an interrupted irrigation season: Micro-drought at the Wind River Indian Reservation. Climate Risk Management.
Connect with EcoPress on social media, like us on Facebook and follow us on Twitter, @nrel_science, for the more stories and news. Follow the North Center Climate Science Center on Twitter, @NorthCenterCSC.