
 How many ecologists never dreamed they would learn a programming language? Me, for one. As an undergrad I came away from an introductory computer course convinced that my brain just wasn’t wired to talk to computers.
However I have since tackled VBA, Perl, and R. I am by no means a programming ninja at any of these languages. In fact VBA and Perl were a love ‘em and leave ‘em experience, learning enough to apply them to a single project but dropping them soon after. R, on the other hand, has stuck.
Why is R so great? First and foremost, R is a versatile tool for ecologists. I first heard R called an emerging ‘language of science’ from Professor Tom Hobbs when I took his Systems Ecology class in 2011. R code used for analyses in publications is increasingly made available online (see examples here and from our very own Andrew Tredennick here), clarifying analyses and supporting collaboration through online tools like Github. It is hard to overstate the scientific value of this kind of transparency in data analysis. There are also several practical benefits to R: it’s open-source and free (unlike, for example, Matlab or SAS), it can make pretty paper-ready graphics, and there are endless online resources (here are a few examples). Run up against a wall? Google your problem and chances are you will find several explanations that will help you on your way. Can’t find an answer? Present your problem in one of the many active online communities (such as on StackOverflow) and you will likely get help.
From a personal perspective, I’ve found th at R adds value to many aspects of my research, from basic statistical analyses and data organization to model development and testing. Also, I actually enjoy it! Keep in mind: I’m still not a ‘natural’. However it’s just as true that I’m not brilliant at learning German. That doesn’t mean I can’t become proficient at communicating in either language, whether ordering dinner in Berlin or telling a computer what to do with my data.
As an aside, I’ve heard some argument that Python is equally valuable (for example, Nathan Lemoine’s post on Python complementing R). However I have not yet worked with Python, and I encourage comments on this topic below from those who are more knowledgeable.
Python debate aside, this brings us back to the intrepid scientist looking to add R programming to their toolbox of scientific skills. You know what you want to do. The next question: where to begin?
To preface, I highly recommend taking a class where learning and using R is a component (at CSU this includes ESS 575, and recently STATs 511/512). Learning a programming language is much more pleasant when there are clear tasks to perform and people responsible for helping you solve your problems.
However sometimes taking a class isn’t feasible, and even with a class you will likely forget your skills (see step 4) between when the class ends and when you have your OWN problem to solve. Plus unless you are entirely devoted to working with models, you will likely have field and lab work (e.g. data collection) interspersed with times when you might want to use R (e.g. data analysis). In short, being able to teach yourself, keep track of the code you’ve written and problems you’ve solved, and efficiently remember what you’ve learned and accomplished are key components in effectively adding R to your research.
The following is one learning approach, with an assortment of useful links and learning tips that I’ve accumulated along the way:
Learning basic R:
- STEP 1: Identify a problem to solve. Remember that the whole point of a programming language is to tell your computer how to take something (data) and do something to it or with it (analysis, restructuring, graphs, etc). What do you have? What do you want to do? Having even a basic problem applicable to your own work will help keep the main goal of this whole effort in mind: using R to do research. I wouldn’t limit your learning to just the R language required to solve this problem, but I guarantee you will feel fantastic when you get to the point where you successfully use your new skills on your own research (see Example 1).

Example 1: A snippet of code from the first time using R for my own work, including how I felt about it when it ran. - STEP 2: Find (and print) a good introduction manual. I keep my messy note-covered R primer from Professor Tom Hobb’s Systems Ecology class next to my computer and refer to it constantly. A quick search for ‘R Introduction Manual’ yields a long list including guides by the R Development Core Team, Germán Rodríguez at Princeton University, and Andreas Handel at University of Georgia. At a glance, I’d recommend the latter, Dr. Handel’s YaRI (Yet Another R Introduction), both for being based heavily on Benjamin Bolker’s “An introduction to R for ecological modeling”, and for being intended as a ‘quick-start’ guide to get you going with R.

- STEP 3: Set up R on your computer. Most introduction manuals will include setup instructions, or you can use a site like this. I use a Windows system and prefer writing code in Notepad++. Therefore I use NPPtoR. However I’ve recently seen the slick design of Rstudio and am considering switching over to that interface.
- STEP 4: Create a structure to manage your work. This step is important. It is subject to in-depth online discussion if you want to really dig in. Here is my abbreviated perspective: As with any language you will become rusty with R as soon as you stop using it regularly. You will also tend to forget the fine details of your code as soon as you’ve moved on to a new topic or problem. This includes forgetting what changes to the code you made and why, becoming utterly lost and wasting hours of effort. You also may want to work on code collaboratively, which is much more difficult if the code is difficult to understand. You may be tempted to dive into learning R and figure this out later, but I STRONGLY recommend putting in the time up-front to structure your workflow and code development if you want R to be a meaningful component of your research. What do I mean by this?
- Figure out a file structure on your computer or get set up on Github (you can request a free educational account) A bad day when working with R is when you take a section of lovely, functioning code, make a bunch of changes, break it, and then you can’t figure out why. A REALLY bad day is when you didn’t save a copy of the functioning code so that you can either go back and start over, or compare broken to functional code and figure out what went wrong. Don’t have really bad days. Github provides a great environment for code development. I strongly encourage that route.
- USE COMMENTS TO CLARIFY YOUR CODE. You will never, ever regret this. Comments are added to R code by beginning a line with #. Good use of comments, combined with good use of variable names, can make code easy to read and understand. (Other general suggestions here; Google even has an R style guide). Use comments at the top of your code to quickly identify important information: describe its function, name the author of the code, track the start and most recent modification dates, etc. Use comments within your code to describe the objective of specific functions, sources of data, etc. Be disciplined in adding comments to your code.
- Additional options to consider: Take notes. I keep a running file of all changes to my code and how they pertain to my research problem so that I can look back across everything done for a given project. Figure out a structure to save useful bits of code. Some scripts, once written, can be used in many ways. Or some scripts can be used as great reference. Figure out where to keep them so they can be easily located.
- STEP 5: Work learning R into your daily schedule. When working through my R primer, I preferred to break it up into regular daily blocks. Others like to hammer through all day every day until it’s done. Whatever works. However keep in mind that if you get stuck on a problem, sometimes the answer to hours of frustration comes in an instant the next day over your first cup of coffee. This has happened to me more than once.
- STEP 6: Follow your learning manual from beginning to end and DO EVERY LEARNING PROBLEM! It is extremely tempting to skip the learning problems, particularly when they are time consuming simple problems that have nothing to do with your research. Even if a learning problem looks simple and entirely logical, work through it anyway. A missing bracket has caused me more headaches than any other problem (see Example 2). Repetition and practice will make you faster and more familiar with the code and its structure. You need to know how to tell R what you want to do, as well as how to fix it when it isn’t working. Practice is the only way!
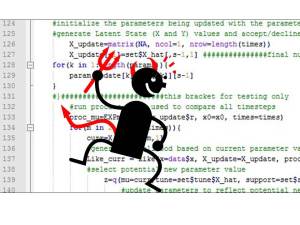
Example 2: This little devil has an arrow for a tail, and that tail is pointing towards a bracket (now commented out and clearly labeled) I used to test a section of code and then promptly forgot. It took me a long time to find this bracket. - STEP 7: Apply your learning to solve your problem. Hopefully you’ve kept track of the applicable bits of the learning manual as you went through it, maybe even diving off when you get to something useful to mess around with your own problem. Perfect! This is how every application of R will work- take a problem, figure out what you need to know to solve it, apply knowledge to solve problem, rinse and repeat.

- STEP 8: Continue learning. Congrats! You have a handle on basic R. I hope you now feel ready to tackle bigger things. The various online resources listed throughout this post will help you get started. However don’t forget about your local resources - CSU offers statistics help, and keeping track of peers using R can be extremely valuable. For example, keep an eye out for R workshops at meetings and conferences. There is an active and easily accessible community of R users and researchers out there. Jump in and have fun!
Is this learning approach useful? Have anything to add? Feel free to post questions and comments below, particularly if you have suggestions for additional resources that will help ecologists get on their way with using R.
Clip art used for the feature image and to illustrate this post is used with permission from Microsoft.