
Written by Stephen Chignell
This article was originally featured on the Remote Sensing in Ecology & Conservation Blog. Original article can be viewed here.
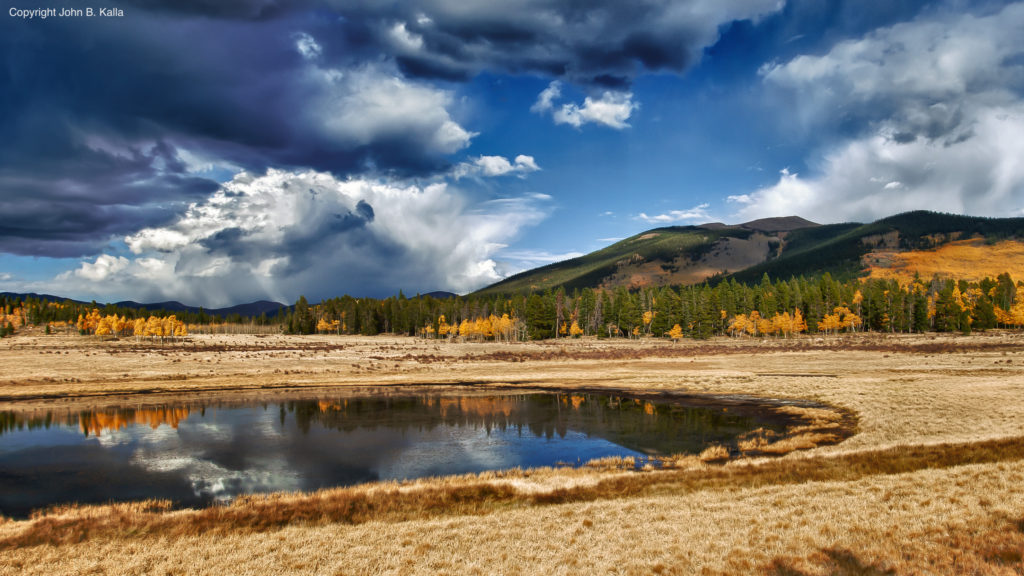
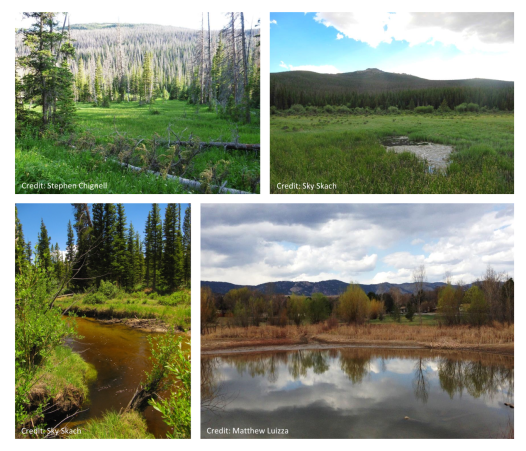
Wetlands and riparian areas are important for an array of landscape functions, including flow regulation, nutrient cycling, and wildlife habitat. However, human activities are resulting in considerable losses of wetlands worldwide, which is of particular concern in semi-arid and arid landscapes like the Western United States.
Accurate maps are key tools for targeting conservation efforts but are time-intensive and costly to produce an update. Mountain wetlands are particularly difficult to map using remote sensing because they experience significant variability across space and time. This is exacerbated in areas with increasing human development because irrigated agriculture can confuse algorithms searching for patterns in spectral data. As a result, few detailed maps of wetlands or riparian areas exist in any mountain region of North America and are even scarcer in most countries around the world.
In our paper published in Remote Sensing in Ecology and Conservation, my colleagues and I explored the use of remote sensing and machine learning for mapping wetlands across a complex and highly managed Colorado watershed. Our goal was to develop a method for mapping mountain wetlands that was accurate, approachable, and broadly applicable.
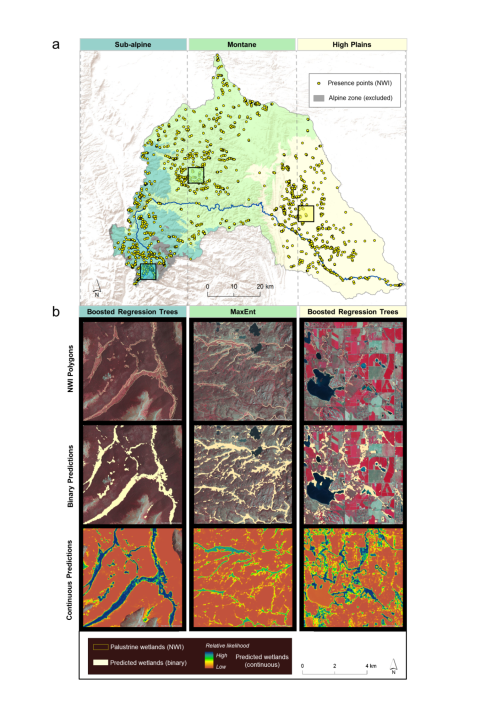
To start, we divided the study area into three elevation zones, each with more homogeneous climate, hydrology, and species composition than the aggregated watershed. This reduced complexity and made it possible to tailor the workflow to the characteristics of each zone.
Using the National Wetlands Inventory and our knowledge from the field, we assembled a set of locations where wetlands and riparian areas are known to be. We then trained machine learning algorithms to identify relationships between the known wetlands and a set of remote sensing variables. We focused on interpretable variables like greenness, wetness, and terrain roughness—all derived from globally available Landsat 8 imagery and the Shuttle Radar Topography Mission.
This process generated predictions of wetland distribution for each elevation zone. The top-performing models were highly accurate, simultaneously capturing a variety of wetlands and riparian zones while avoiding confusion with irrigated agriculture and open water. We also found that different algorithms performed better in different elevation zones. This highlights the importance of testing and comparing different classification techniques.
Because we used a carefully selected set of predictor variables, we were able to interpret their relative importance in each model through an ecological lens. This provided important context for conventional accuracy statistics and helped us garner feedback from local wetland scientists and land managers.
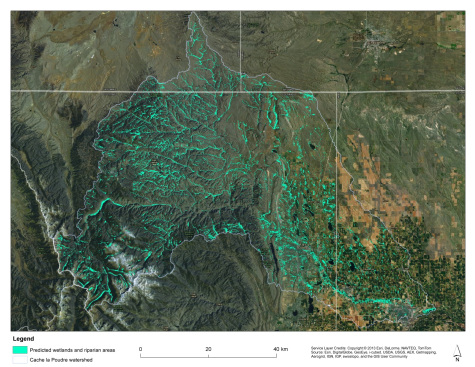
Our project shows that it is possible to accurately map wetlands in extremely complex mountain landscapes using free and widely available remote sensing data. The workflow can be easily adapted to other mountain regions where data and resources are scarce.
While the paper provides technical details of our approach, we have distilled lessons learned from this and other projects into the guidelines below:
Six simple guidelines for mapping mountain wetlands with remote sensing data and correlative species distribution models
Break it up
- Break the study area into regions that have similar ecological, hydrological, and anthropogenic characteristics, and develop separate models for each.
- Altitudinal life zones may be a good option in mountain regions, and are often available in the literature.
Integrate field-based knowledge
- Are your remote sensing variables ecologically interpretable?
- Consult local experts (non-remote sensing scientists).
- Make use of existing field data for training and/or testing, even if incomplete.
Consider regional characteristics
- Select image dates that relate to the ecology and hydrology of the target wetlands.
- Use geomorphometric variables to identify landforms related to wetland formation.
- Consider anthropogenic factors such as agricultural cycles.
Limit model inputs
- Avoid site-specific data sets that might limit wider application of your method.
- Start simple, and add more complexity when necessary.
Compare and Experiment
- Compare multiple algorithms, variables, and evaluation statistics.
- Use an iterative workflow of variable selection, model development, and interpretation.
Use all model outputs
- Continuous models provide more information, but binary maps can also be useful.
- Make sure to recognize the limitations of each.
Stephen Chignell recently completed a MS in Watershed Science with Dr. Melinda Laituri at Colorado State University. He is interested in geospatial approaches for understanding the geography of water, land use, and development.